My review of Knowi, the augmented analytics and business intelligence platform
My experiences with BI tools
When selecting a Business Intelligence (BI) tool for aggregating and visualizing datasets there are an ever-expanding list of options and they all sound promising – so where to start? As a BI developer the most revealing takeaway from client meetings that deal with data requirements is that, ironically, most clients don’t understand what questions to ask. They might have specific questions that they are curious about but mostly they want the “data guy” to help them make sense of their data. No pressure. They’re overwhelmed with industry buzzwords and everyone seems to have a tailored job title. All they really want is to give someone the data and walk away. This is an inherent flaw. I have worked extensively in Qlik Sense and Tableau (among others) throughout my career and find that most BI platforms have barriers of entry that are impractical for most non-developers – sometimes they are convoluted by design. JavaScript language scripting and SQL queries are the most restrictive barriers that I have experienced.
Often times the developers don’t understand the industry and industry leaders don’t understand BI development; causing misunderstandings, developer handoffs (causing serious reporting lags), and the dreaded back-and-forth that haunts consulting and developing. Knowi’s platform offers a solution that could eliminate these disconnects.
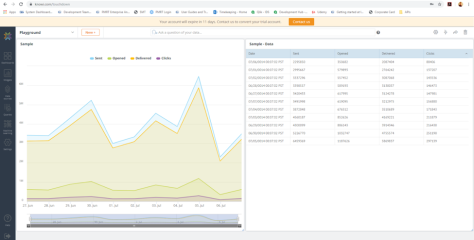
My first attempt visualizing data in Knowi
First impressions of Knowi
As a web-based platform, my first impression of Knowi reminds me of Looker. Undoubtedly a good product but Looker is limited to structured databases (SQL) and is tailored more towards existing developers. The same applies to Tableau and Qlik Sense which are industry-leading BI tools but completely useless when dealing with NoSQL databases involving clusters, collections, and documents. Knowi offers a tool that can take unstructured and otherwise incoherent databases and enables non-developers to gain actionable insights. Here are a few of my favorite features.
RESTful APIs
First-things-first, you have to connect to your dataset. Knowi built guiding arrows (which is a small but very helpful feature) that catch your eye to help you get started. Selecting “New Dataset” shows an impressive list of RESTful APIs as well as the ability to upload a flat file from your desktop in several formats. After typing in the necessary connection information I’m off and running in less than a minute.
JOINS for combining datasets
Combining datasets can be intimidating and time consuming even for a developer. Knowi offers implicit JOINS to assist with getting the full scope of what your data can offer. Adjustments can be made but the algorithm involved is user-friendly and intuitive.
Dataset statistics
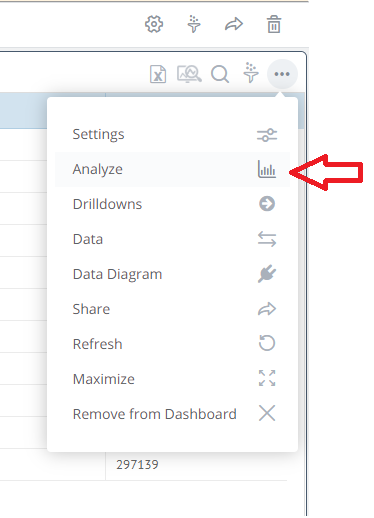
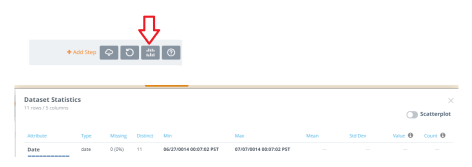
After creating a dashboard, Knowi’s default shows a standard table of your data. The “Analyze” function in the top right corner enables you to see dataset statistics at a glance. This, quite often, is all that a client may want. Between all the confusing buzzwords and pressure to make fancy graphs often times the client just wants simple metrics showing counts, standard deviations, missing values, and a scatterplot to help show relationships. Any developer or analyst will attest that best practice involves running these metrics before anything else.
Worth noting: From my experience, these first three features can sometimes take an analyst or developer the afternoon or a full day to compile and code properly in a platform like Tableau or Looker. I was able to do this with Knowi in under 5 minutes without writing any code.
Natural Language Processing (NLP) Queries
NLP is a huge seller in current 3rd generation BI tools. Natural language processing business intelligence–also now sometimes called “smart analytics”–is important because people don’t think like computers, people think like people, and not all BI tools can process NLP effectively. I was impressed with the algorithm written by Knowi as well as its placement in the dashboard. This feature further enables the user to be able to populate actionable insights without writing a single line of code.

Exporting to CSV and sharing
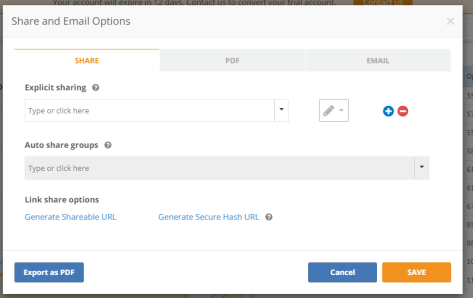
I put these two options together because they are overwhelmingly the most requested options in business intelligence and analytics. Everyone grew up with Excel, PDF, and email and for a lot of clients this is where their technical knowledge (and interest) hits a brick wall. Sharing in these formats can be done with the click of a mouse from your dashboard. Scheduling recurring emailed reports, exporting a quick PDF, or exporting to Excel so the client can analyze the data any way they wish is an attractive feature of this platform. This sounds like a simple and obvious feature to offer but several legacy BI and analytics platforms do not offer this as an out-of-the-box functionality. Often times out of frustration, when working in a platform other than Knowi, I will use the Microsoft Windows Snipping Tool offered in the Windows OS to email reports or create PowerPoint slides.

Embedded analytics: Iframes and shareable URLs
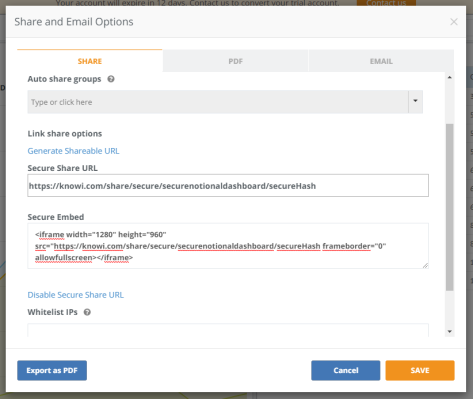
This is undoubtedly my personal favorite feature of the business intelligence world. And when it comes to shareable and embedded analytics, Knowi has some impressive features. In the “Share” feature on the dashboard there is the “Link share options” selection. Generating a shareable URL will provide a link that anyone can click on to see a fully dynamic visualization (compared to sharing a PDF or JPEG that is static) or you can provide an iframe (found in the “Secured Embed” box) to an HTML front end developer. This iframe will enable your fully dynamic visualization to appear in any website on any server. This feature adds value by making data fully accessible, live, and in the hands of the decision-makers in any format that makes their lives easier.
Conclusions & Outlook
What I most appreciated about Knowi’s platform was the scope of their out-of-the-box product offering. For one price you have access to everything you would ever need to dig into your data as deep or and shallow as you like – many other BI tools pricing models offer a la carte or third-party expansions that take time, client approvals, and more money. There are several other features that I enjoy about this product but was able to provide my short-list of favorites that offer applications to a broad scope of clients. Additionally, the full scope of analysis capabilities and Knowi’s ability to communicate NoSQL database information is exceeding competing platforms like Looker. These Knowi platform offerings make data less intimidating and offer database owners a way to use their data without waiting, expanding their operation, or hiring a developer. Knowi would be perfect for small companies or startups with a mountain of data but no established business intelligence infrastructure, or for the established enterprise company looking to unify the data spread across their organization for added insights. I would very quickly recommend Knowi to any decision-maker who wants actionable information without the lag of sending it to a developer, any data analyst who has a meeting in thirty minutes and no idea where to even begin, and any seasoned developer who wants a fully functioning and comprehensive platform that they can embed in their application.
Last but not least, I appreciated that they let you sign up for a free trial with nothing more than an email address. A lot of BI companies make you talk with a sales rep before you ever get to actually try the product and see if it might be right for you.
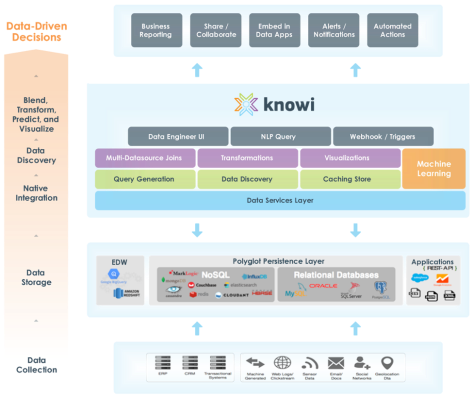
For those who want to look at a slightly more abstract diagram of the Knowi architecture, I pulled this from their website.
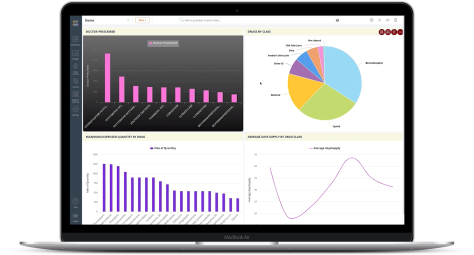
However, the best way to learn is to just dive in and try connecting some data, I made the following dashboard with Knowi’s test data and AirBNB data from their open source database.

Disclosure: the Knowi team was happy to provide some comments and images (like the featured image) when producing this article.
