Review of Knowi – BI Tool

My review of Knowi, the augmented analytics and business intelligence platform

unnamed

My experiences with BI tools

When selecting a Business Intelligence (BI) tool for aggregating and visualizing datasets there are an ever-expanding list of options and they all sound promising – so where to start? As a BI developer the most revealing takeaway from client meetings that deal with data requirements is that, ironically, most clients don’t understand what questions to ask.  They might have specific questions that they are curious about but mostly they want the “data guy” to help them make sense of their data.  No pressure.  They’re overwhelmed with industry buzzwords and everyone seems to have a tailored job title.  All they really want is to give someone the data and walk away.  This is an inherent flaw.  I have worked extensively in Qlik Sense and Tableau (among others) throughout my career and find that most BI platforms have barriers of entry that are impractical for most non-developers – sometimes they are convoluted by design. JavaScript language scripting and SQL queries are the most restrictive barriers that I have experienced.

Often times the developers don’t understand the industry and industry leaders don’t understand BI development; causing misunderstandings, developer handoffs (causing serious reporting lags), and the dreaded back-and-forth that haunts consulting and developing.  Knowi’s platform offers a solution that could eliminate these disconnects.

Picture1

My first attempt visualizing data in Knowi

First impressions of Knowi

As a web-based platform, my first impression of Knowi reminds me of Looker. Undoubtedly a good product but Looker is limited to structured databases (SQL) and is tailored more towards existing developers.  The same applies to Tableau and Qlik Sense which are industry-leading BI tools but completely useless when dealing with NoSQL databases involving clusters, collections, and documents. Knowi offers a tool that can take unstructured and otherwise incoherent databases and enables non-developers to gain actionable insights.  Here are a few of my favorite features.

RESTful APIs

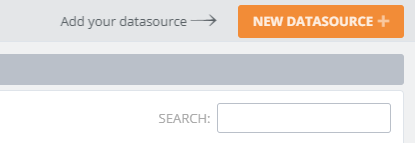
First-things-first, you have to connect to your dataset.  Knowi built guiding arrows (which is a small but very helpful feature) that catch your eye to help you get started. Selecting “New Dataset” shows an impressive list of RESTful APIs as well as the ability to upload a flat file from your desktop in several formats.  After typing in the necessary connection information I’m off and running in less than a minute.

Figure 1

JOINS for combining datasets

Combining datasets can be intimidating and time consuming even for a developer.  Knowi offers implicit JOINS to assist with getting the full scope of what your data can offer.  Adjustments can be made but the algorithm involved is user-friendly and intuitive.
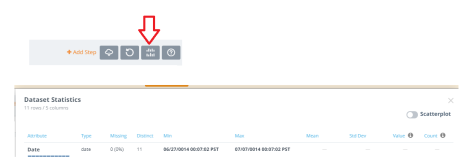
Dataset statistics

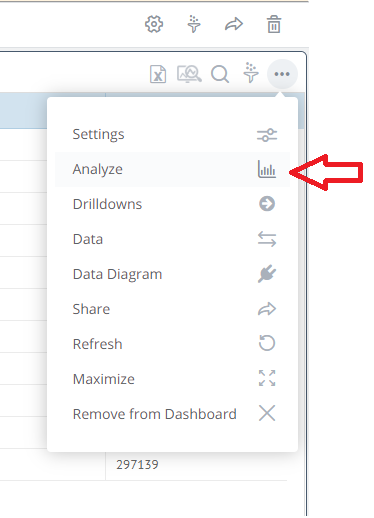
After creating a dashboard, Knowi’s default shows a standard table of your data. The “Analyze” function in the top right corner enables you to see dataset statistics at a glance.  This, quite often, is all that a client may want.   Between all the confusing buzzwords and pressure to make fancy graphs often times the client just wants simple metrics showing counts, standard deviations, missing values, and a scatterplot to help show relationships.  Any developer or analyst will attest that best practice involves running these metrics before anything else.

Figure 2

Worth noting: From my experience, these first three features can sometimes take an analyst or developer the afternoon or a full day to compile and code properly in a platform like Tableau or Looker.  I was able to do this with Knowi in under 5 minutes without writing any code.

Figure 3 - Copy

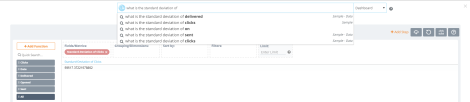
Natural Language Processing (NLP) Queries


NLP is a huge seller in current 3rd generation BI tools. Natural language processing business intelligence–also now sometimes called “smart analytics”–is important because people don’t think like computers, people think like people, and not all BI tools can process NLP effectively. I was impressed with the algorithm written by Knowi as well as its placement in the dashboard.  This feature further enables the user to be able to populate actionable insights without writing a single line of code.

Figure 4


Exporting to CSV and sharing

I put these two options together because they are overwhelmingly the most requested options in business intelligence and analytics.  Everyone grew up with Excel, PDF, and email and for a lot of clients this is where their technical knowledge (and interest) hits a brick wall.  Sharing in these formats can be done with the click of a mouse from your dashboard. Scheduling recurring emailed reports, exporting a quick PDF, or exporting to Excel so the client can analyze the data any way they wish is an attractive feature of this platform.  This sounds like a simple and obvious feature to offer but several legacy BI and analytics platforms do not offer this as an out-of-the-box functionality.  Often times out of frustration, when working in a platform other than Knowi, I will use the Microsoft Windows Snipping Tool offered in the Windows OS to email reports or create PowerPoint slides.

Figure 5

Figure 6

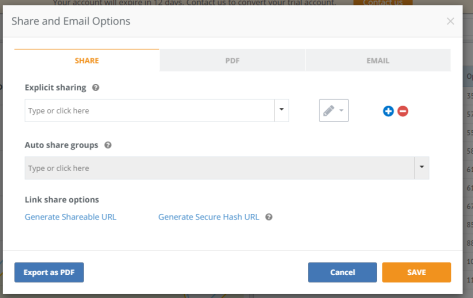
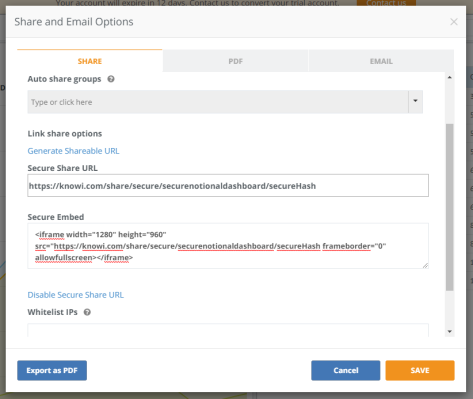
 Embedded analytics: Iframes and shareable URLs

This is undoubtedly my personal favorite feature of the business intelligence world. And when it comes to shareable and embedded analytics, Knowi has some impressive features.  In the “Share” feature on the dashboard there is the “Link share options” selection. Generating a shareable URL will provide a link that anyone can click on to see a fully dynamic visualization (compared to sharing a PDF or JPEG that is static) or you can provide an iframe (found in the “Secured Embed” box) to an HTML front end developer. This iframe will enable your fully dynamic visualization to appear in any website on any server. This feature adds value by making data fully accessible, live, and in the hands of the decision-makers in any format that makes their lives easier.

Figure 7

Conclusions & Outlook

What I most appreciated about Knowi’s platform was the scope of their out-of-the-box product offering.  For one price you have access to everything you would ever need to dig into your data as deep or and shallow as you like – many other BI tools pricing models offer a la carte or third-party expansions that take time, client approvals, and more money.   There are several other features that I enjoy about this product but was able to provide my short-list of favorites that offer applications to a broad scope of clients.  Additionally, the full scope of analysis capabilities and Knowi’s ability to communicate NoSQL database information is exceeding competing platforms like Looker.  These Knowi platform offerings make data less intimidating and offer database owners a way to use their data without waiting, expanding their operation, or hiring a developer. Knowi would be perfect for small companies or startups with a mountain of data but no established business intelligence infrastructure, or for the established enterprise company looking to unify the data spread across their organization for added insights. I would very quickly recommend Knowi to any decision-maker who wants actionable information without the lag of sending it to a developer, any data analyst who has a meeting in thirty minutes and no idea where to even begin, and any seasoned developer who wants a fully functioning and comprehensive platform that they can embed in their application.

Last but not least, I appreciated that they let you sign up for a free trial with nothing more than an email address. A lot of BI companies make you talk with a sales rep before you ever get to actually try the product and see if it might be right for you.

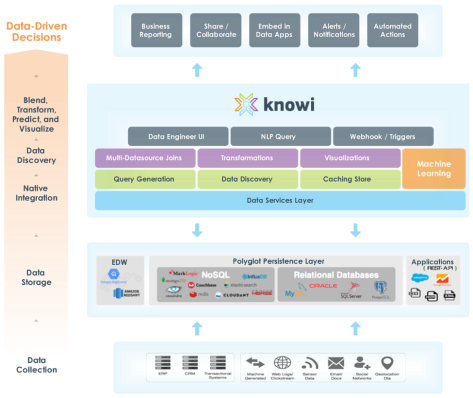
For those who want to look at a slightly more abstract diagram of the Knowi architecture, I pulled this from their website.

Picture2

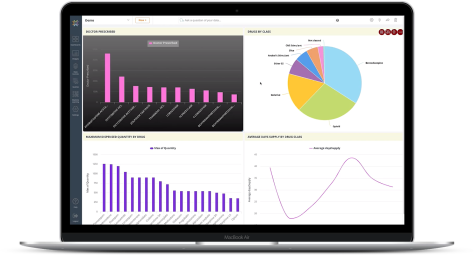
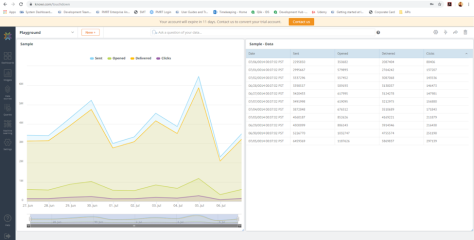
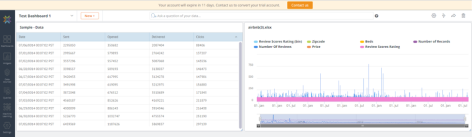
However, the best way to learn is to just dive in and try connecting some data, I made the following dashboard with Knowi’s test data and AirBNB data from their open source database.

Picture3


Disclosure: the Knowi team was happy to provide some comments and images (like the featured image) when producing this article.


Hiatus and Return!

Food Made Me Say It

Hi all – I know it’s been awhile since I posted.  If you follow me on Instagram though, you’ve seen that I’ve been quiet but not starving.  This past year has been a busy whirlwind – that culminated with me quitting my job in DC and moving to NYC!  Well, to Jersey City, which is right across the river and allows me more space for the four fur children. But that means a new city with new food and new adventures.  I don’t do New Year’s resolutions but I am going to try to post more here.  I think this will be easier to keep because I’m happier here, I can feel it.  I’ve always liked to eat but I never wanted to go out in DC but I’ve been in Jersey City a little over a week and I’m hardly ever in the apartment!  So much exploring and of…

View original post 411 more words

Data Science: data without the science

There’s a heavy dependence on data statistical analysis in business and our lives. People are biased; they lie, they make assumptions, and they have been proven time and again to make irrational decisions, but data doesn’t lie…or does it? We’re in a digital renaissance and times are changing faster than we can possibly keep up with, it’s important to get it right. I believe in the awesome power of statistics, but it’s easy to see how the human touch, or lack of, can skew results.

An algorithm is basically a big, complicated IF/THEN logic statement (retrieve junior high math class from the memory banks). If A and B then C. If you’re young (A) and broke (B) then here is an advertisement for a Happy Hour (C). Everyone has had to fill out a resume profile that will never be seen by a human being; we log on to Facebook and see ads specifically geared towards our demographic information, and we hear statistics in every aspect of our lives. The irony is, statistics can only aggregate the information you give it, and it gets it wrong all the time, sometimes tragically so. You may have extensive experience in an industry but because your resume didn’t have a buzzword, it will never make it past the online portal. Thanks Oracle. You may be a childless 30-year-old woman, but Facebook keeps showing ads for baby strollers simply because you liked one of your friend’s pictures with an identifying hashtag. Thanks Facebook. You might be a young white man and not have use of your legs but because you watched one video on YouTube about Mixed Martial Arts you are now bombarded with ads for gym groupons. Thanks YouTube. I think you get my point. Why then, if data gets us wrong so easily, do we trust it so much?

Causation through statistics is a huge part of analysis, but it also gets it epically wrong sometimes. A few examples of statistical causation gone bananas:

The age of Miss America is 87% correlated to murders by steam, hot vapors, and hot objects. Statistically, you must be able to predict a change in one item with the other? Not at all.

pic 1

Crude Oil imports from Norway and drivers killed in collisions with railway trains shows a 95% correlation…

pic 2

The consumption of cheese and people who died by being tangled in their bedsheets also shows a 95% correlation…

pic 3

Economists have controlled searches for these results, calling them “spurious correlations”, but it goes to show how complicated and out of control some statistical models can become without some finesse. Any human can tell that these correlations are nonsense, but according to the fundamentals of Data Science, they have overwhelming causation. The only thing keeping these graphs out of a business presentation is common-sense. That’s where the human touch comes in. When building a statistical model or machine-learning algorithm, we must control for certain variables that are either completely unknown, or assumed to be identical throughout the population.  Like in Jurassic Park when they use frog DNA to fill in the gene sequence gaps; in the absence of complete information, we do the best we can.  Referring to my previous examples: Facebook is assuming that a 30-year-old woman is a mother and that a young white man watching MMA would want to join a gym.  The underlying assumptions need to be as unbiased as possible, or not exist at all, for the statistical model to work properly. Additionally, common-sense needs to be applied when interpreting the results and determining market causation before the information is delivered.

This TED Radio Hour Podcast shows an excellent example of building algorithms that are ultimately biased against women and African Americans.  Algorithms only know what we teach it through internal historical information.  So, if only men have historically been successful within a certain company (because of sexism) programming a resume-bot to filter resumes to see only the most likely people to be successful will unintentionally filter out more women than men.  If historically, people are more successful who have had no employment gaps in their resumes that show X, Y, and Z skills (simply by happenstance because the economy was good prior to 2007) then people who experienced prolonged unemployment during the recession and do not have X, Y, and Z would also be unintentionally filtered.  Common-sense tells us that these people should not be immediately disqualified.  Cyclical causality is an inevitable byproduct of human programming and using historical information to build automation, we must be careful not to simply automate the status quo.

Dr Cathy O’Neil, in her book “Weapons of Math Destruction” refers to Data Science as data without the science.  Science is repeatable, it uses the scientific method, it is peer-reviewed, and offers evidence supporting its conclusions. Data science offers no such infrastructure. It is all about who owns it, who is interpreting it, what assumptions are made when the data is incomplete, how the data is collected, what their motivations are with the information, and how it is applied. Making the process repeatable with identical results is virtually impossible, unless the same human biases and assumptions are applied to the same sample of data.

Math and science have set us free from the dark ages of superstition and religious dogma. Getting statistics right and holding data accountable is necessary if we are to grow as a digital civilization. Cloud computing, social media, and business intelligence techniques have made us exposed to so many statistics that it’s hard to tell what’s what. Evolving from using underlying assumptions as well as providing controls within the complexities of data is key to advancing into Artificial Intelligence (AI) and quantum computing.

Food for thought. Thank you for your time.

“73.6% of all statistics are made up on the spot” – a smart-ass

“There are three kinds of lies: lies, damn lies and statistics.” – Prime Minister of Great Britain, Benjamin Disraeli

Minimum Wage is Lowered in St. Louis

Effective August 28th, St Louis’ minimum wage has been decreased from $10 an hour to $7.70 in an unprecedented political move. Objecting to minimum wage hikes has always been seen as political suicide, but lowering an existing wage is bananas.

What happened? Seattle tried the $15 wage hike, implementing it in stages so as not to shock the system too much and it was, in the big picture, an epic failure.  According to an NBER Working Paper wages for those making under $19 increased by 3 percent, the number of hours worked dropped by 9%; resulting in an overall lower income for the minimum wage earners.  It’s easy to connect the dots and see how raising the minimum wage above the natural rate is unsustainable.  People are calling this move “theft” and “political overreach”, but according to economic reasoning, it was really the only option.

It’s easy to get caught up in the politics and emotions of it all, $7.70 an hour is an insulting and unsustainable wage; companies should be embarrassed paying anybody that much money to do anything.  I agree; but a higher wage than what the market demands, as is seen with government-mandated wage hikes, encourages adjustments elsewhere in the market.  It encourages innovations in automation, lowering hours, increasing work-loads, and overall decrease in income.  In the short run, you’re looking at a decrease in hours and benefits (as seen in Seattle) as the market attempts to correct itself and return to equilibrium.  This causes more political pressure as people feel the squeeze, further pushing aggregate wages downward as companies have more incentives to eliminate low-wage jobs and invest in automation.

So what can we do? We can’t expect people to live on a pittance and we can’t force companies to pay more because they simply will not.  Forced market adjustments aren’t the answer either; the market always adjusts.  We need to take this time to invest in our people and eliminate low-wage jobs entirely.  This sounds bananas as well, but if employees engage in higher education and trade programs, and gradually automate their jobs at the same time, we can minimize the wage gap and economic shock.  Automation is happening whether we like it or not, and the $15 an hour movement is only speeding it up.

Just some food for thought.

Sources:

Click to access NBER%20Working%20Paper.pdf

http://reason.com/blog/2017/06/27/seattles-minimum-wage-is-harming-low-wag

http://reason.com/blog/2017/08/29/the-minimum-wage-cut-in-st-louis-is-bad

http://www.seattletimes.com/nation-world/minimum-wage-raise-given-to-st-louis-workers-is-taken-away/

Veterans and the Job Interview

I was sitting in a job interview and my interviewer asked me: “What more could we be doing for our veterans?” with a genuine look of concern and respect on her face. Those who know me personally know my stance on my veteran status; it’s a private and personal experience for everyone. My favorite response is “It’s not Saving Private Ryan, it’s Pizza Hut and Wi-fi”. No two experiences are the same and mine is no different, but to ask the direct question like that I was forced to really sit back and think about it. The only answer I could come up with was: “What’s left?”

We live in an age of respect and concern for our veterans unprecedented by any other time or place in history. Gone are the days of “baby-killers” and “grunts”. A lot of us have seen some horrible stuff, and a lot of us bellyache over working long hours in an office; it’s all a very personal experience, but we all enjoy the benefits: access to higher education, home loans, mental health counseling, tax breaks, and preferential hiring. It’s not as simple as throwing money around or saluting at a baseball game. We’re people and just like every adult, regardless whether they are a veteran or not, we will never overcome our experiences, or have a good life until we take responsibility for ourselves.

From my point of view, it’s a self-esteem issue. Soldiers are taught a very unique set of skills through shame and scare-tactics. A lot of veterans are treated like second-class citizens for the sake of a larger goal, then return to society greeted with confusion, entitlements, and blind respect; it’s confusing. I can only speak for my experience but there are a lot of us who want no attention whatsoever, we simply want to move on with our lives and deal with our experiences privately. Self-esteem is a systemic problem in the world nowadays and ignoring it makes it worse, but there’s a fine line between coddling and being supportive. It’s OK to have conflicting experiences about authority, your place in society, what it means to be an adult, etc… it’s not OK to sit on your ass and complain about it. There’s something to be said for the old adage “go out and get a job”.

So when you see a veteran and want to say “Thank you for your service”, that’s cool, and thank you for your support.  A better question thought though, would be: “What have you done today to help yourself?” Because with all of the entitlements afforded to us, the only thing standing in the way of our success is ourselves.

This is Why Economists Don’t run for President

The other day I was listening to a rerun of a Planet Money Podcast and it made me want to revisit my stance on the housing market manipulation (Planet Money: Episode 387; article) .  They brought six (6) ideologically divided economists into the studio to discuss what policies they could all agree on, and then jokingly mentioned how, “This is why economists don’t run for President”.  I agree that the results of the panel are unpopular and think that they managed to properly address the real reason people don’t want to listen to economists; we use boring language and tell people what they don’t want to hear.  I agree with some of these policies, disagree with others. The policies were: eliminate the mortgage tax deduction; end the tax-deduction companies get for providing health care to employees; eliminate the corporate income tax; eliminate all income and payroll taxes; tax carbon emissions; and legalize marijuana.  Obviously, no voter in their right mind would agree to most of these, especially using words like “eliminate” and “tax”.

Eliminating the mortgage tax deduction:  This is, across the board, agreed to be a positive change by the experts and if you read my other blogs about the housing market you would think I agree.  I do, mostly; but there are flaws in simply “eliminating” a policy that has been on the books for so long, and helps a lot of people hold onto their money.  The argument made is that this would decrease the demand for the wealthy to own property, lowering the overall price of real-estate, and thereby making all housing more affordable for everyone.  Sounds nice, but it’s not as simple as it sounds.  Real-estate prices (like wages) are sticky and, as the market always shows, people would rather hold onto a property than sell it for less than they paid for it.  What does that mean, exactly? It means that the price of homes may plateau, they may build fewer homes, they may build more rental properties, but the only way to ensure the overall price of housing will not go down is by lowering the amount of homes in the market, not lowering the price of existing homes.  This is a key point that we need to understand.  If your home is worth $300,000 today, it will not cost $299,999 tomorrow; the entire economic system would go into chaos, not to mention the deflationary expectations associated with that.  If prices begin to fall, people will expect them to keep falling, taking more people out of the market who are waiting for the price to stabilize.  As more people exit the market, this will send the prices down even further, and then it’s 2007 all over again.  Eliminating this deduction would cause developers to build more rental properties since there would be less demand for purchasing homes.  People need a place to live, so intuitively as the demand to buy homes decreases, the demand for renting would increase, forcing people into higher rents and further creating an imbalance in the market.

My solution: Eliminate the deduction but wait until there is another structural shift in the market.  In economics, if prices of final goods are trending upwards as most do, changing a piece of that market won’t make a big difference; i.e. lowering the price of tires won’t cause the price of cars (a final good) to go down; lowering the price of gas won’t make airfare cheaper; and lowering the demand for home loans won’t cause the price of homes to go down. Unless you catch the trending price when there is a market correction.  We saw one in 2007, that would have been the time to eliminate the deduction since the housing market was already changing structurally.  Doing it now would be white-noise and may possibly slow the growth of the price of housing but not cause the intended multiplier effect the economists in the podcast are discussing.

End the tax-deduction companies get for providing healthcare to employees:  This is wildly unpopular but hear me out.  Everyone needs healthcare and it has become a part of an employee’s compensation, but incentivizing companies to provide more and more comprehensive healthcare coverage instead of paying employees causes stagnation of wages (which we are currently experiencing) and unsustainable healthcare costs (which we are also current experiencing).  Someone with a “Cadillac” health insurance plan is more likely to go to the hospital for small ailments and doctors are more likely to run unnecessary test since they know their insurance will pay.  X-rays do not cost $500, bandages do not cost $250, and it does not cost $600 for an ambulance to drive ½ a mile.  Hospitals charge these insane prices because for every seven (7) people who use these services and can’t pay, there’s one person with a Cadillac plan who can, eliminating their marginal loss.  So Cadillac plans pay out more, making them cost more, but companies keep offering them and people are happy to accept them as part of their compensation.  Eliminating a deduction for employer-provided healthcare would decrease the unchecked pricing of hospital services and the price of insurance overall.

Eliminate the corporate income tax: Sounds like a terrible idea, and it probably is, but it just might work if done correctly.   Corporate income tax keeps companies from redistributing their earnings back into growth and their stakeholders.  Even if they keep it in the bank and do nothing with it, it will increase the amount of loanable funds on the market, lowering the interest rates, and helping everyone else get access to better loans.  We want people to pay their fair share, but blanket-taxing corporations for simply doing business here is an oversimplification of the problem. We need to tax the individuals receiving dividends on corporate profits.  It’s a delicate balance of taxing companies enough to maintain a healthy revenue stream and preventing them from leaving and going overseas.  Regular citizens can’t vote with their feet and relocate, corporations can.  It’s unfair and upsetting but it’s the world we live in.

Eliminate all income and payroll taxes, tax carbon emissions, and legalize marijuana: Eliminating payroll taxes would be an easy sell.  Nobody likes paying taxes and it would increase the real wage.  Companies would be pressured to raise wages since taxes are lower and people would have more income to spend on goods. This would have to be done in stages to eliminate too much inflation at once, but switching to a consumption tax rather than an income tax would redistribute the tax burden to the wealthy, who buy more stuff, and less on the poor, who don’t.

Taxing carbon emissions is a natural conclusion to the times we live in.  Taxes serve two purposes – raise revenues and create disincentives for that activity by raising the price.  Seems like a no-brainer.

Legalizing Marijuana is inevitable, people are doing it anyways and it’s less dangerous than drinking.  Legalize it, tax it, get rid of the underground market, tell people not to drive while on it, penalize them if they do, and move on to other issues.

These proposals are universally recognized and systemic problems in the current economy.  The panelists have excellent ideas with sound economic reasoning.  I got hung up on the housing deduction proposal because of the follow-through, but if these policies are worded correctly to the public and implemented responsibly there’s no reason why they couldn’t be successful.

Thank you for you time.

Giving the Market a Push

The Great Recession has shown us that markets have equilibrium, but that we sometimes need to give it a little push in the right direction or else we could spiral out of control; again.  The Hoover Dam got money circulating and caused a multiplier effect that helped rejuvenate the economy, World War II (unfortunately) got men and women back to work and provided a much needed sense of purpose, the fiscal stimulus of 2009 (arguably) saved the United States from calamity, and automatic stabilizers such as unemployment insurance help to minimize the effects of a loss of wages on the overall economy. We have come a long way since 1929 and still have a long way to go. As an economist and a fiscal-conservative I disagree with an over-regulated market, price-floors, and an overreaching government; but as recent economic events have shown, markets are more complicated and synthetic to adjust appropriately on their own.

One example of this is from a recent article by The Brookings Institute that shows a serious, yet ubiquitous, problem in predatory lending: pay-day loans. I have already blogged about some other industries that thrive on predatory lending and pay-day loans are subject to the same nefarious business practices.  The article summarizes that the Consumer Financial Protection Bureau (CFPB) passed legislation changing the nature of the vetting process for pay-day loan-sharking from debt-to-income ratios to a more reasonable ability-to-pay matrix for non-prime lenders as well as limiting the amount of loans they are able to take out.  Will this industry change? Absolutely. Will market innovation create new opportunities to lend to non-prime borrowers? Absolutely.  This market is littered with moral hazards so the only option is to keep a close eye on predatory financing.  George Akerlof and Robert Shiller did a great job bringing phishing scams to light (Phishing for Phools), showing that with every market comes an opportunity to take advantage.

Another such push is the Department of Labor’s Wage and Hours Division’s expansion of the Fair Labor Act that increased the overtime salary exemptions from a minimum of $23,660/year ($455/week) to $47,476/year ($913/week).  This should affect over 4 million people in the country and give a “meaningful boost to many workers’ wallets”.  I am of two minds about this legislation and my fellow blogger Adam posted about this recently in THIS BLOG POST.  The economic forces behind the need for price floors are tricky and sometimes self-defeating.  A higher nominal wage could overheat the market and cause a lower real wage; meaning that if employers are forced to pay people more they will simply hire less people in an attempt to return to a balanced aggregate wage.  This is not a one-for-one exchange, and often leads to lower aggregate wages and higher unemployment in the big picture.  Over-time exemption criteria increases are a synthetic aspect of the labor wage market but necessary nonetheless.  The unemployment rate has been lowering and overall consumption is up (www.bls.gov), this should (if Keynes was right) cause an increase in wages and inflation in the market, but it hasn’t.  A higher wage will give existing employees a much-needed break, and it’s time, but this could also create a disincentive to hire future employees.  I guess we’ll wait and see.

Fiscal policy is a relatively new addition to economics and we’re all trying to make sense of a post-recession world.  Obviously, letting markets adjust naturally doesn’t work, but how far do we push regulation to make course corrections? It’s easy to see effects of fiscal policy with the luxury of hindsight and, as an armchair quarterback, I could write a dissertation on changing policies after the Great Recession, but we live in a world of uncharted waters and need to simply do the best we can with the information we have.  Hopefully we can get it right once in awhile.

The new economy has changed everything, one man's attempt to make sense of it all